Rated Top Property Management Company in Ontario 6 years in a Row: $10.1B in Assets, 22,000+ Leased and Managed Properties with Rental Guarantees!
Welcome to the #1 rated property management company, with 17 office locations servicing 40+ regions across Ontario, Canada. With a proven track record of success, we have leased and managed over 22,000 rental properties across the province, valued at over $10.1 billion. Our team of specialists are dedicated to being your trusted partner for all your property management needs.
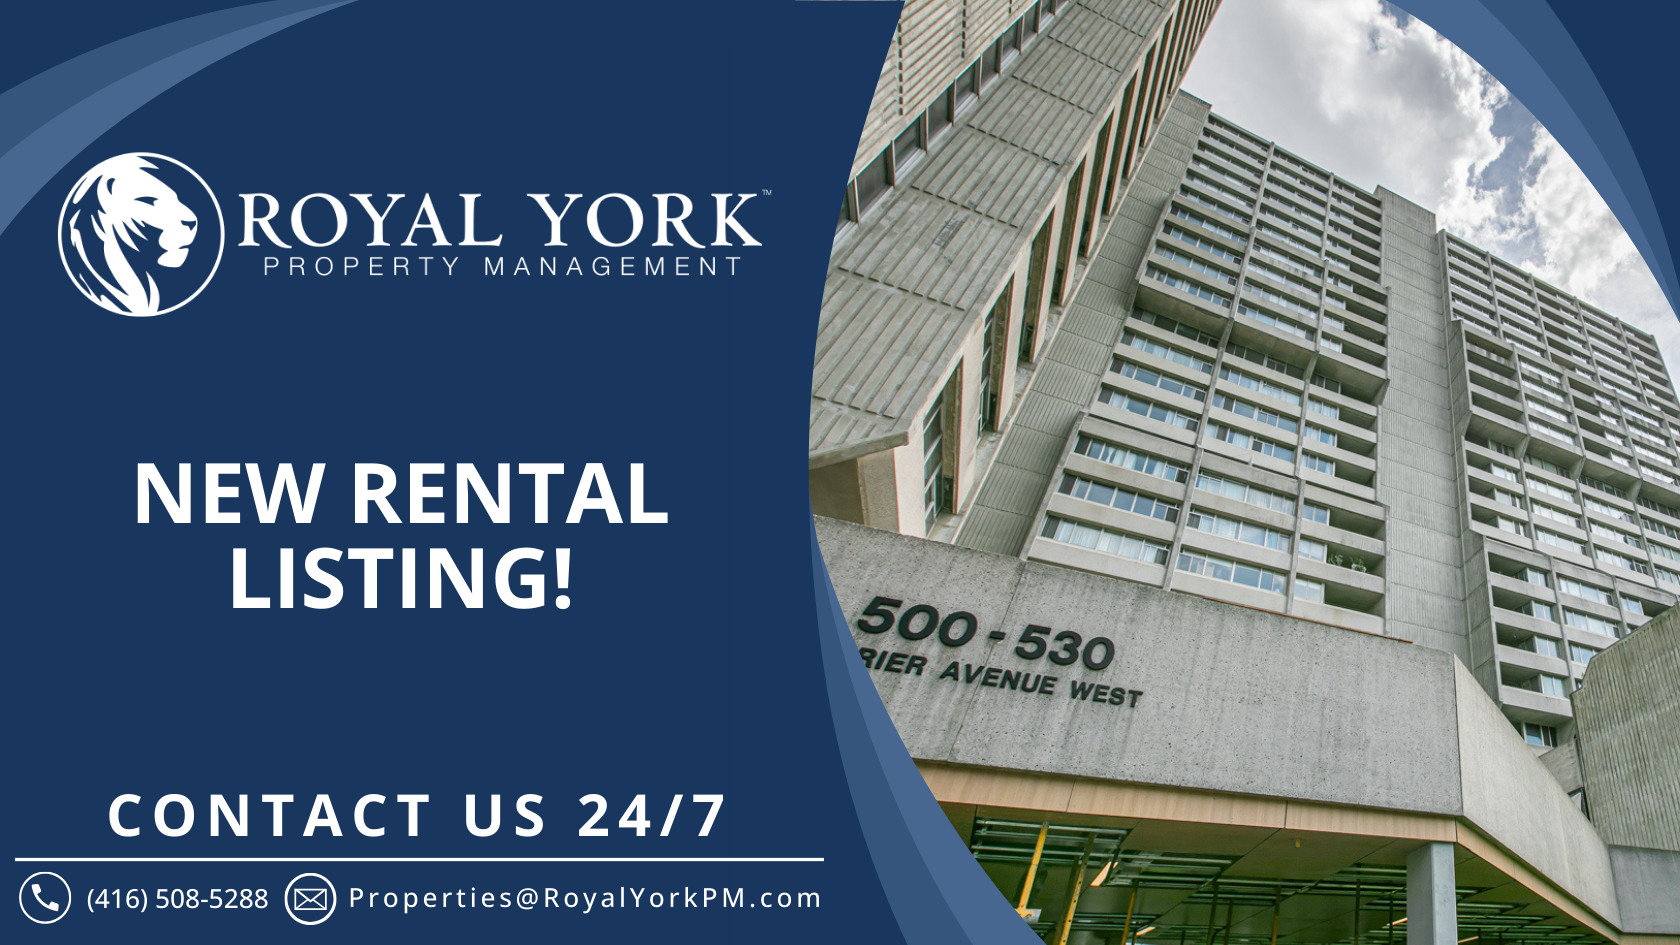
CALL US 24/7: (416) 508 5288